November 18, 2019 4:07PM
By Alex Nowrasteh. CATO
Over the weekend, the U.S. Citizenship and Immigration Services (USCIS) updated an earlier report on arrests and apprehensions of illegal immigrants who requested Deferred Action for Childhood Arrivals (DACA). The updated report shows that of the 888,818 people who applied for DACA, 118,371 had been arrested at one time or another.
Many of those arrested were not approved for DACA, but some were because many arrests don’t lead to convictions. Those 118,371 people had been arrested a total of 202,025 times for all crimes and civil infractions, including violations of immigration law. Subtracting the number arrested for immigration infractions lowers the number to 95,343 DACA applicants being arrested. The DACA applicant arrest rate was 80 percent below the non-DACA applicant (all others) arrest rate.
The USCIS report does not provide arrest rates for DACA applicants or other populations in the United States. As a result, there is no standard of comparison for the number of arrests mentioned in the USCIS report. However, some data released in the report do allow for a back of the envelope comparison between the arrest rate for DACA applicants and the arrest rate for the population of all others.
Below, I will describe the comparative arrest rates and how I calculated them.
Comparing arrest rates requires making two simple assumptions. First, I assume that the youngest person arrested who was a DACA applicant was 13 years old and that arrest occurred in 1993 (DACA is only available to those born in 1981 or later). This is based on Table 6 of the USCIS report that breaks down arrests by age. Only 5,076 of the arrests were of DACA applicants age 14 or younger. Changing the year does not affect the direction of the outcomes.
Second, I compare the number of arrests and not the number of individual people arrested. This is because FBI crime data record the number of arrests, not the number of people arrested. Third, I don’t exclude any of the arrests counted in the USCIS document even though the FBI’s crime data doesn’t include immigration arrests in its national figures. That second choice biases the results against me because it increases the number of arrests of DACA applicants relative to the citizen population who cannot be arrested for immigration offenses.
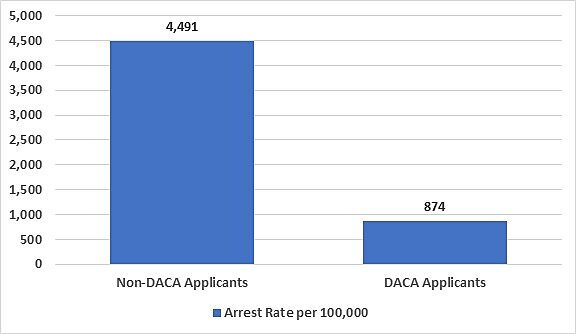
From 1993 to 2018, about 344.9 million total criminal arrests were made in the United States. Of those arrests, 202,025 arrests were of DACA applicants. The arrest rate for DACA applicants was 874 per 100,000 DACA applicants per year from 1993 through 2018 (Figure 1). The arrest rate for all others was 4,491 per every 100,000 per year. In other words, the arrest rate for all others was about 5.1 times as great as it was for DACA applicants. DACA applicants had an arrest rate 80 percent below that of all others.
Table 1
Annual Arrest Rates of DACA Applicants and All Others per 100,000, 1993-2018
Sources: FBI, USCIS, and Author’s Calculations.
Note: Arrests per 100,000 for each subpopulation.
Even if all those arrests of DACA applicants took place from 2012-2018 (DACA was announced in 2012), their arrest rate would be 3,247 per every 100,000 DACA applicants per year. That is still below the arrest rate for all others of 3,429 per year during the same time. Excluding immigration arrests lower the relative arrest rates even more. For instance, excluding immigration arrests from the 1993-2018 period diminishes the DACA applicant arrest rate from 874 per 100,000 DACA applicants per year to 775 per 100,000.
No matter how you compare the arrest rate for DACA applicants to all others, the former group has a lower arrest rate. Since the USCIS report and this post just measure arrest rates, the criminal conviction rate is necessarily lower as there are more arrests than convictions – as I show in Texas. The USCIS report is just further evidence that illegal immigrants have a lower crime rate than native-born Americans.
Topics
ImmigrationTags
USCIS, DACA, Crime, arrest rates, 2019
This work is licensed under a Creative Commons Attribution-NonCommercial-ShareAlike 4.0 International License.

Please Donate


You must be logged in to post a comment.